Make In-App Campaigns easy and successful
Go live with in-app campaigns faster than ever. Target precisely, schedule seamlessly, and test all you want. Power it all with rich analytics to rinse and repeat.
Learn more
Go live with in-app campaigns faster than ever. Target precisely, schedule seamlessly, and test all you want. Power it all with rich analytics to rinse and repeat.
Learn more
In his bestselling book, Hooked, Dr. Nir Eyal describes habit-forming products as ‘nice-to-haves’ that gradually become ‘must-have.’ With consumers doubling down on shopping, gaming, and OTT content, average mobile app usage jumped 40% year-on-year in 2020 alone- a not so subtle shift in consumer behavior.
Brands have every reason to rejoice except for one little problem – user retention.
Even as install rates grew in double-digits, most apps saw as much as a 12% decline in retention rates across categories.
Moreover, as the cost of customer acquisition increases- influencer promotions, paid ads – usage frequency is increasingly coming into focus. After all, that is when the user journey and value creation really begins.
As a growth marketer, you probably watch KPIs like Daily Average User (DAU) and Monthly Average User (MAU) for your app like a hawk. However, these metrics only track the number of unique users that interact with your app on a daily or monthly basis. They do not give you more granular information, such as the average number of sessions per user.
The truth is that you need to calculate the average number of sessions per user on a daily or monthly basis to assess the popularity of your app objectively. Most mobile marketing tools display the count of sessions or usage frequency as an absolute metric. In other words, they only show the total number of sessions on a consolidated basis.
However, you can divide the total number of sessions by DAU to identify how many times each user engages with your app. Combined with other KPIs like average session length, this can give you key insights into its ‘stickiness.’
Ultimately, you can leverage this data to segment your audience and focus on users that are the most ‘natural fit’ for your type of app.
Speaking of which, mobile app usage rates can vary depending on the category they come under. For example, a health and fitness app may be used much more often than a tax planning app that is typically used no more than once or twice a year.
Therefore, to objectively assess your engagement and user retention versus the competition, you need to consider how users use your app. In this article, we will do a deep dive into the different factors that influence the average mobile app usage frequency.
Not all apps are meant to be used daily. The engagement curve of a gaming app, for example, will show a lot more activity than one that is used for viewing documents.
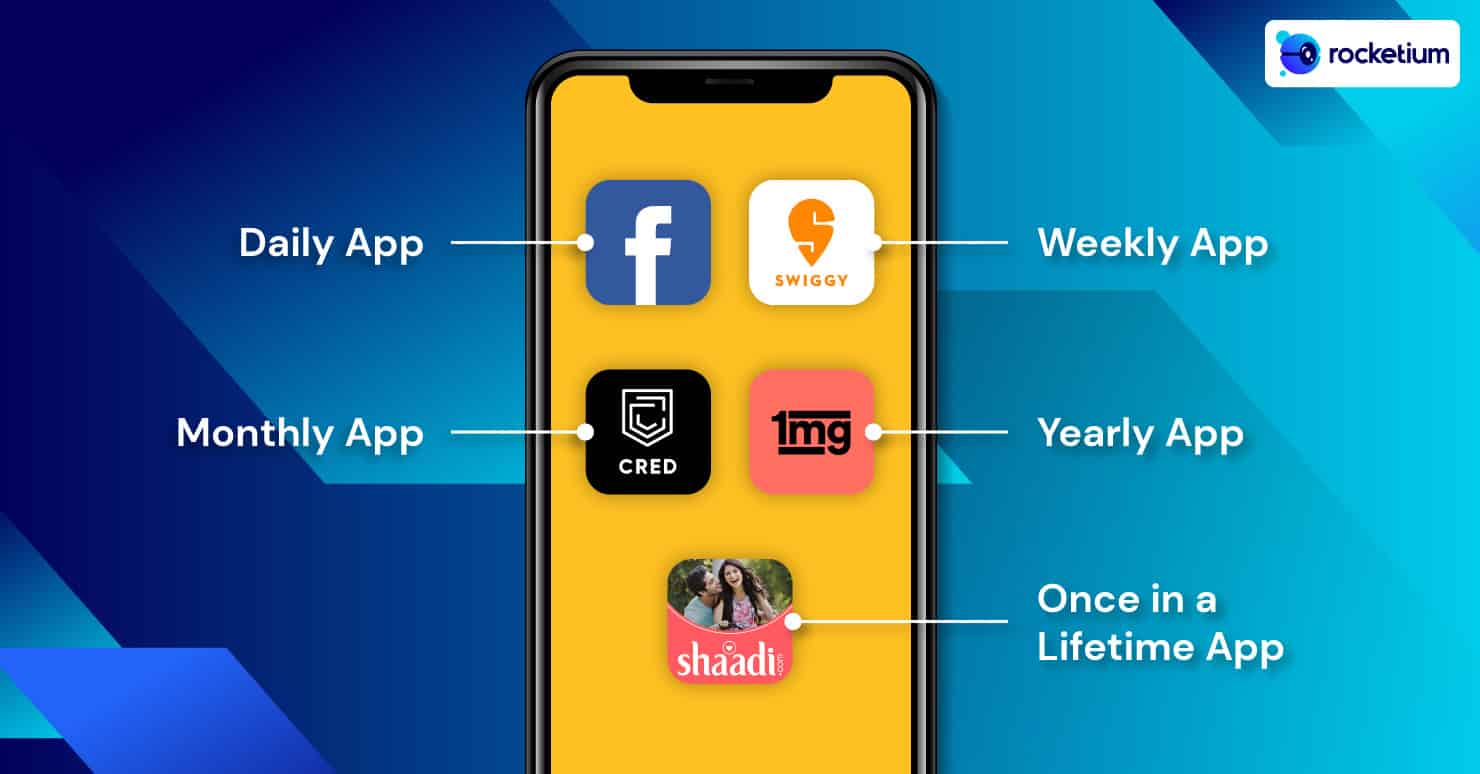
So, using the right time intervals is critical to developing the right user retention strategy. Based on their average usage frequency, apps can thus be classified into daily, weekly, monthly, yearly, and once-in-a-lifetime apps.
Social media apps have continued to top the charts in terms of usage frequency. In 2020, Facebook was voted the most essential mobile app, with Instagram coming in a close second. The reason: most users tend to subconsciously click on their notifications as soon as they show up.
For this reason, daily apps have among the highest engagement rates across most demographics or user groups. Popular instant messaging, streaming, and business apps, including Gmail, Whatsapp, Netflix, Spotify, Asana, Trello, etc., also fall under this category.
Shopping for groceries and other essential items is a weekly routine for most people, with the possible exception of bachelors! With apps like BigBasket, Swiggy, and Licious, you can expect an interval of around 5 to 7 days between log-ins.
If 80% or more of your users are active on your app every seven days or so, yours is a weekly app.
If the typical duration between two interactions is around 30 days, measuring user retention weekly is likely to give you a skewed picture. To arrive at the correct retention rate, you would need to look at users that have been active at least twice in about one month.
Apps used for budgeting, investing, or paying utility bills like Cred, Groww, or Amazon Pay, etc. are examples of monthly apps. Again, it is the interval between two separate visits that determines whether an app can be classified as a monthly app. For example, apps with a minimum of 2 visits every 60 days.
Whether renewing your insurance policies or filing tax returns, apps that see user activity about once a year come under this category. Other examples include doctor consultation apps like Practo, 1mg, etc.
The conversion window for calculating user retention in the case of such apps is two years. In other words, users should have a mobile app usage frequency of at least two transactions during this time to be considered active.
This category is at the other extreme in terms of mobile app usage frequency. Matrimonial apps like Shaadi.com or Jeevansathi.com can be counted as once-in-a-lifetime apps, given that the bonds of marriage usually last a lifetime.
Such apps witness steady usage for a few weeks or months after registration, followed by a plateau.

As a KPI, the average number of sessions per DAU can provide critical insights into your mobile app usage frequency. This data can then be used by your sales and marketing teams to boost in-app purchases and referrals.
Here are a few approaches you can take advantage of to draw users further down your sales funnels.
Daily apps are, by definition, the stickiest of them all. They do not need a lot of persuasion for people to start using them.
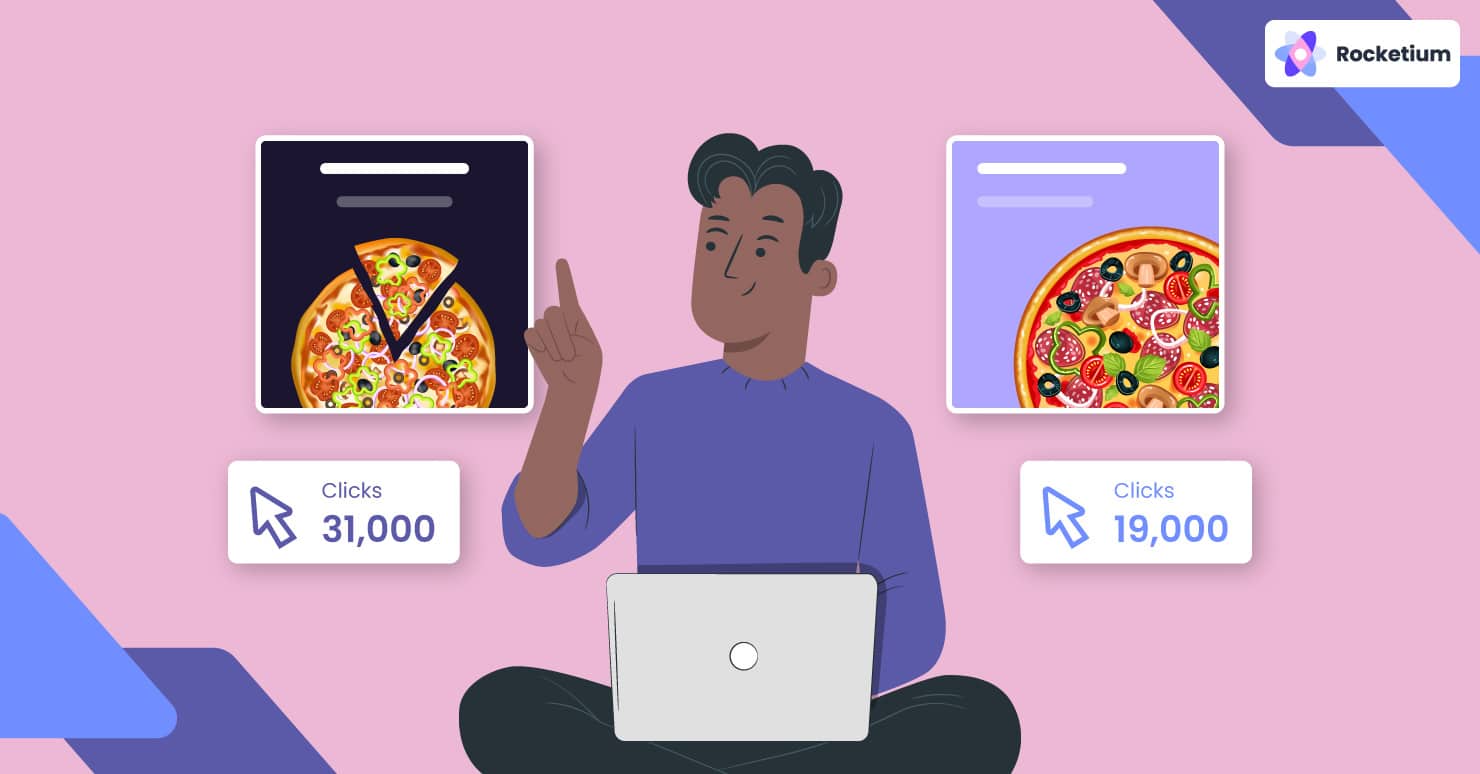
For example, a Facebook notification is a trigger that most users respond to without second thought. One reason for this is that it serves content personalized to each user.
In the digital age, customers expect personalized experiences. This is especially true for millennials, who now make up the single largest consumer group on the planet.
Netflix and Spotify are some other great examples of apps that come up with show recommendations and playlists based on a user’s browsing history.
Netflix is known to collect data such as content categories searched, view history, and keywords used. Based on this data, it displays its “top picks” for users to watch.
Spotify uses similar data to come up with recommended playlists. Tracking customer behavior can help you engage users throughout their journey and turn them into brand advocates.
The result: better customer lifetime value and referrals. The first step is to segment your user base based on mobile app usage and create a content strategy that consistently meets its needs.
If most of your users interact with your app on a given day of the week, you need to create more reasons for them to keep coming back. This is where push notifications can come in handy.
For example, online shopping apps usually send a behavior-driven notification to users that haven’t purchased within a few days of sign-up. It usually includes a promo code that can be used to make their first purchase. To build urgency, the offer validity is limited to 24 to 48 hours.
If an item is no longer in stock, a lost sale can be averted by sending interested customers a notification as soon as new inventory is available.
Amazon has fine-tuned its app experience to send instant alerts to customers that show the intent to buy but don’t complete checkout.
The time window within which you choose to send behavior-driven notifications is just as important. One too many notifications in a short period can backfire.
Keep the user’s time zone in mind when sending notifications.
The latest trend to have caught on is using voice, image, and video-based notifications, all reporting higher engagement rates than plain text.
However, contextual or in-app notifications can be just as effective in guiding customers through specific actions step by step.
For example, Evernote has a ‘walk-through’ feature that highlights newly-added features, introduced as part of an update, step-by-step. This can open up upsell and cross-sell opportunities in terms of subscriptions and upgrades.
If users interact with your app only about once every 30 days, you need to make every ‘micro’ moment count. Micro-moments are triggers that drive customers to look for or learn about something.
Anticipating potential user actions during these moments is critical for apps with longer intervals between sessions.
This is where tools like chatbots and/or live chat can make a world of difference in terms of mobile app usage frequency and user retention.
Focussing on a seamless UI/UX flow is just as important. Customer Effort Score (CES) has become a priority for brands lately as users tend to equate a clunky design with professionalism.
In a nutshell, CES means that the longer it takes for users to complete an action, the poorer their experience is likely to be. The slickest marketing campaigns cannot make up for a negative first-hand interaction.

Experts recommend that brands follow a 2 step process to design their UI.
1. Focus on what the user wants to accomplish based on where they currently are in the buyer journey.
2. Design the visual elements around those actions. On the same note, it is important to avoid cluttering a tab or page by adding too many elements.
For smartphone users, this can be a cue to abandon their shopping cart- a key problem for eCommerce brands the world over.
Done right, an intuitive UI can boost mobile app usage frequency, increase average order size and multiply referrals.
For example, ‘one-tap’ social media sharing options for referral links.
Brands with app interaction cycles of around 12 months often resign themselves to spending heavily on marketing with little impact on user retention.
Many sign-up influencers and/or run affiliate programs to shore up engagement.
However, a low-hanging fruit for such brands in terms of growing mobile app usage is optimizing UI/X.
After all, there is no substitute for a seamless experience. Apps score over offline channels in providing on-demand access to a variety of services, especially on the move.
Insurance brands, for example, pride themselves on factors like claim settlement ratio.
Mobile apps can give them a competitive advantage- minimizing overall processing time and offering value-added services such as ‘live’ status tacking and FAQs.
Doctor consultation apps like Practo use analytics to attribute installs to specific affiliates and compare the performance of other channels like email or SMS marketing.
Once-in-a-lifetime apps need a proactive content marketing strategy for driving top-of-the-mind brand recall.
This can include webinars, blogs, interactive videos, and social media. The onboarding experience is critical when it comes to boosting mobile app usage rates.
Apps like Shaadi.com and Jeevansathi.com ask users a series of questions during sign-up to learn about their likes and dislikes. (The key here is to avoid going overboard with the type or number of questions you ask).
This data is then used to deliver personalized content based on user persona.
A video introduction about the workflow and its features can also help reassure users and their family members who may be anxious about finding the right match.
During the lockdown, almost every matrimonial brand worth the name rolled out in-app and video calling features to allow one-on-one interactions and virtual meet-ups between two or more users.
This led to a 60% increase in engagement for Jeevansathi.com, with others reporting increased activation rates, especially in Tier-II and Tier-III cities.

Push notifications and in-app messages directing users to carefully curated ‘how to’ blog articles around relationships and married life are also proven to boost engagement.
Social media trends can also be leveraged to come up with relevant topics that will appeal to users.
Keeping mobile app usage frequency in mind can help improve customer lifetime value and keep a firm grip on acquisition costs. With the market at a major inflection point, this can help you deliver a compelling user experience and reduce time to value.